Statistics Dashboard
Monitor real-time and historical resource usage across all users.
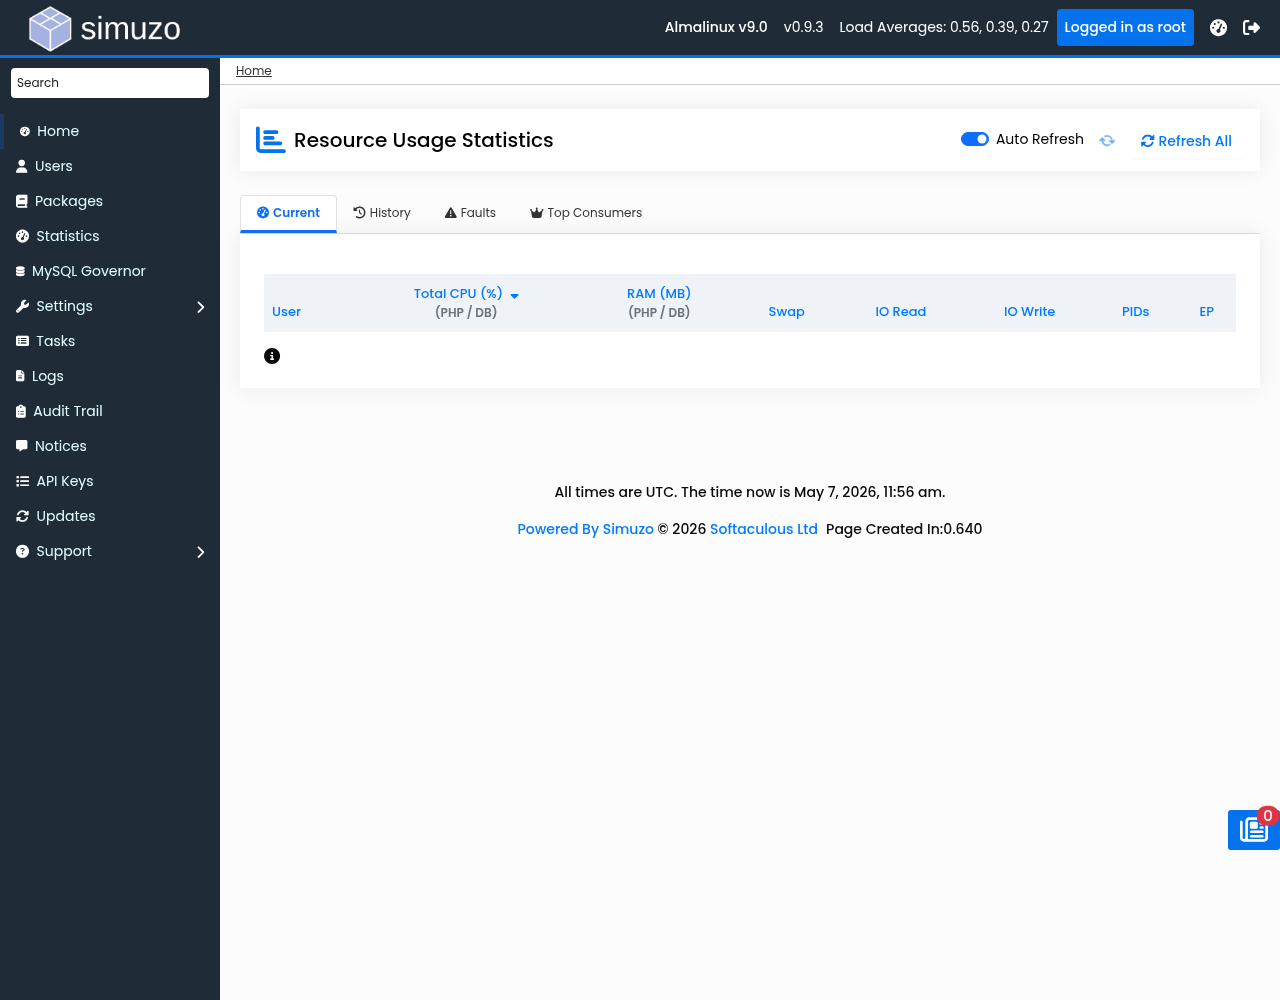 Real-time resource monitoring showing CPU, Memory, and IO usage.
Accessing Statistics
Navigate to Statistics in the Admin Panel. The dashboard has four tabs:
- Current — Real-time resource usage
- History — Historical usage data
- Faults — Resource limit violations
- Top Consumers — Highest resource users
Current Usage Tab
Real-time resource monitoring shows live data for all users.
Metrics Displayed
| Column | Description |
|---|---|
| User | Username |
| CPU | Regular CPU usage percentage |
| DB CPU | Database CPU usage percentage |
| Total CPU | Combined CPU (CPU + DB CPU) |
| RAM | Regular memory usage in MB |
| DB RAM | Database memory usage in MB |
| Total RAM | Combined memory (RAM + DB RAM) |
| PIDs | Regular process count |
| DB PIDs | Database process count |
| IO Read | Read throughput in KB/s |
| IO Write | Write throughput in KB/s |
| IO | Total IO (Read + Write) |
| EP | Entry Processes (current/limit) |
Sorting
Click any column header to sort by that metric. Default sorting is by Total CPU.
Data Refresh
Data automatically refreshes at the interval configured in Settings (default: 1 minute).
History Tab
View historical resource usage over time.
Options
| Option | Values | Description |
|---|---|---|
| Period | 1h, 6h, 24h, 7d, 30d | Time period to display |
| User Filter | Any user | Filter by specific user |
| Limit | 1-1000 | Number of data points |
Data Points
History shows collected metrics at regular intervals:
- Timestamp
- CPU usage (total)
- RAM usage (total)
- IO operations (combined)
- PID count (combined)
- Entry Processes
Faults Tab
Shows resource limit violations that have occurred.
Fault Data
| Field | Description |
|---|---|
| Time | When the fault occurred |
| User | Username that triggered the fault |
| Type | Fault type (CPU, RAM, IO, EP) |
| Value | Actual value that exceeded limit |
| Limit | The limit that was exceeded |
Options
| Option | Values | Description |
|---|---|---|
| Period | 1h, 6h, 24h, 7d, 30d | Time period to search |
| Limit | 1-500 | Number of fault records |
Top Consumers Tab
Identifies users with the highest resource consumption.
Options
| Option | Values | Description |
|---|---|---|
| Metric | CPU, RAM, IO, PIDs | Resource to rank by |
| Period | 1h, 6h, 24h, 7d, 30d | Time period to analyze |
| Limit | 1-100 | Number of top users to show |
Use Cases
- Identify users needing limit increases
- Find users abusing resources
- Plan capacity upgrades
- Optimize resource allocation
Statistics Collection
Statistics are collected by the simuzo-stats service.
Configuration
Settings in Settings → General:
| Setting | Default | Range | Description |
|---|---|---|---|
| Collection Interval | 1 minute | 1-60 minutes | How often stats are collected |
| Retention Period | 7 days | 7-365 days | How long history is kept |
Service Management
# Check service status
systemctl status simuzo-stats

# Restart service
systemctl restart simuzo-stats

# View logs
journalctl -u simuzo-stats
Data Storage
Live statistics are stored at:
/run/simuzo/stats.jsonHistorical data is stored in the Simuzo database.
API Access
Statistics are available via API:
# Get current stats as JSON
GET /admin.php?act=stats&api=json&tab=current

# Get history
GET /admin.php?act=stats&api=json&tab=history&period=24h

# Get faults
GET /admin.php?act=stats&api=json&tab=faults&period=24h

# Get top consumers
GET /admin.php?act=stats&api=json&tab=top&metric=cpu&period=24h
Troubleshooting
Statistics Not Updating
- Check service:
systemctl status simuzo-stats - Verify file exists:
ls -la /run/simuzo/stats.json - Check collection interval in settings
- Review logs
Missing Data
- Check retention settings
- Verify database connectivity
- Check disk space
Related Topics
- Resource Limits — Configure user limits
- Settings — Configure collection settings
- End User Resource Usage — What users see